
Capabilities
Telecom geo-analytics, built in, not assembled
neo360 is built for telecom, not adapted to it. The network analytics a telco actually runs on, site and sector, band-wise coverage, LAC-RAC-TAC, network potential, traffic, 5G FWA, are primitives in the platform. The departmental modules ship with it. The map is the interface, the analytics are the product.
Get a demo →The idea
Built for telecom, not adapted to it
Most analytics stacks are general purpose, and a telco spends months bending them to fit site IDs, sector lobes, band plans and coverage rasters. neo360 starts the other way around. It is a geo-analytics platform tailormade for telcos, where the network primitives are already part of the product and the map is the interface you work on.
That changes what an analyst opens in the morning. Instead of exporting the same network and business data into a fresh spreadsheet per department, every team works off one map-centric platform: the network layer and the business layer, fused, queried in place.
Network analytics
The telecom primitives, already in the platform
These are not dashboards you assemble from scratch. They are the analytics neo360 ships with, built around how a mobile network is actually structured.
Site and sector management
Manage the network estate down to the sector, with POI layers, on the map rather than in a register.
Site and band-wise coverage
See coverage per site and per band, and read it down to grid level across the footprint.
LAC-RAC-TAC analytics
Work with the network's own area codes as first-class analytic dimensions, not as imported labels.
Competition coverage overlay
Put your existing network coverage and competitor presence on the same map to compare them directly.
Coverage on custom routes
Analyse coverage along the corridors that matter, including railway routes and national highways.
Network potential by quality
Score the network by quality band, good, moderate and poor, to see where potential is being lost.
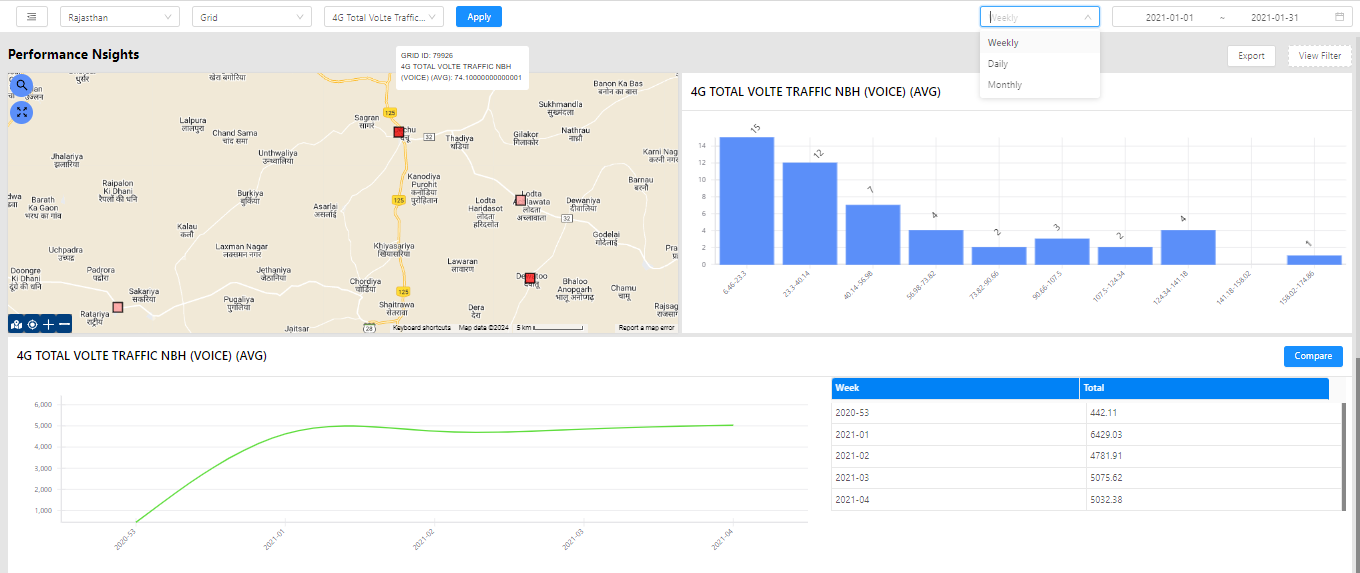
Network traffic analysis
Read traffic against the network so capacity and demand sit on the same picture.
KPI manager and grid-level coverage
A standardized KPI framework with gap analysis, resolved down to grid level on the map.
Make it yours
User-configurable analytics, not a fixed report
Beyond the built-in set, neo360 lets teams build smart dashboards on the fly and configure their own analytics, so the platform tracks how a given operator runs rather than forcing a single template on every market.
One organisation, one platform.
The network layer and every department's view resolve onto the same map cell. Finance, Sales, Network and Support stop reconciling separate spreadsheets and read one shared picture instead.
Departmental modules
The whole telco, out of the box
neo360 does not stop at the network. It ships departmental analytics modules that plug in for the teams across a telco, so the same map-centric platform serves the people who run the business, not only the people who run the radio.
- 01
Finance
P&L, budgeting, cash flow and forecasting, and vendor settlements, in one view.
- 02
Sales
Target performance, lead conversion, closure insights and forecasts.
- 03
Marketing
A single view of the audience, campaign metrics, conversions and buying patterns.
- 04
Product
Competitive benchmarking, product performance and launch insights.
- 05
Customer Support
A one-view customer profile, efficiency KPIs and sentiment.
- 06
Operations
Location intelligence, efficiency KPIs and cost optimization.
Every layer reads from the same data
The modules are not separate tools bolted together. neo360 ingests data from many sources and formats, OSS, call records, network inventory, CRM, business KPIs, voice of customer, crowd-sourced data and the data warehouse, and fuses the network layer with the business layer on one map.
Because it is one platform, a finance forecast and a coverage gap sit on the same picture, and every department stops exporting the same data into a different spreadsheet.
5G FWA
Feasibility before you roll a truck
neo360 includes a 5G FWA planning module that answers feasibility on the map. It checks precise line of sight without a site visit, detects Fresnel zone obstruction, and runs sector-level macro-analytics so you can see the worth of adding lobes before you commit them. The module pairs with rfMAP's high-precision 3D data, so feasibility is read against real buildings, vegetation and terrain.
What ships in the platform
- 01
Map as the interface
Browser-based immersive dashboards where the network and the business are read together, not in separate reports.
- 02
Smart dashboards and gap analysis
Build custom views on the fly and compare actuals against a standardized KPI framework.
- 03
Ingest any source
Pull in data across many sources and formats, from OSS to CRM to the data warehouse, onto one platform.
Proof
Live with a major operator
neo360 is an active platform with a live deployment at Vodafone. It is built for the scale and structure of a real mobile network, not a generic dashboard pointed at telecom data.
- Site and sector
- Band-wise coverage
- LAC-RAC-TAC
- Network potential
- Traffic analysis
- 5G FWA planning
See your network and your business on one map.
Walk through neo360 with our team on your own telecom data, from network coverage to department KPIs.
Get a demo →