
neo360 · Geo-Analytics for Telecom
See your whole telco on one map.
Network data and business data on one map, so every team reads the same picture.
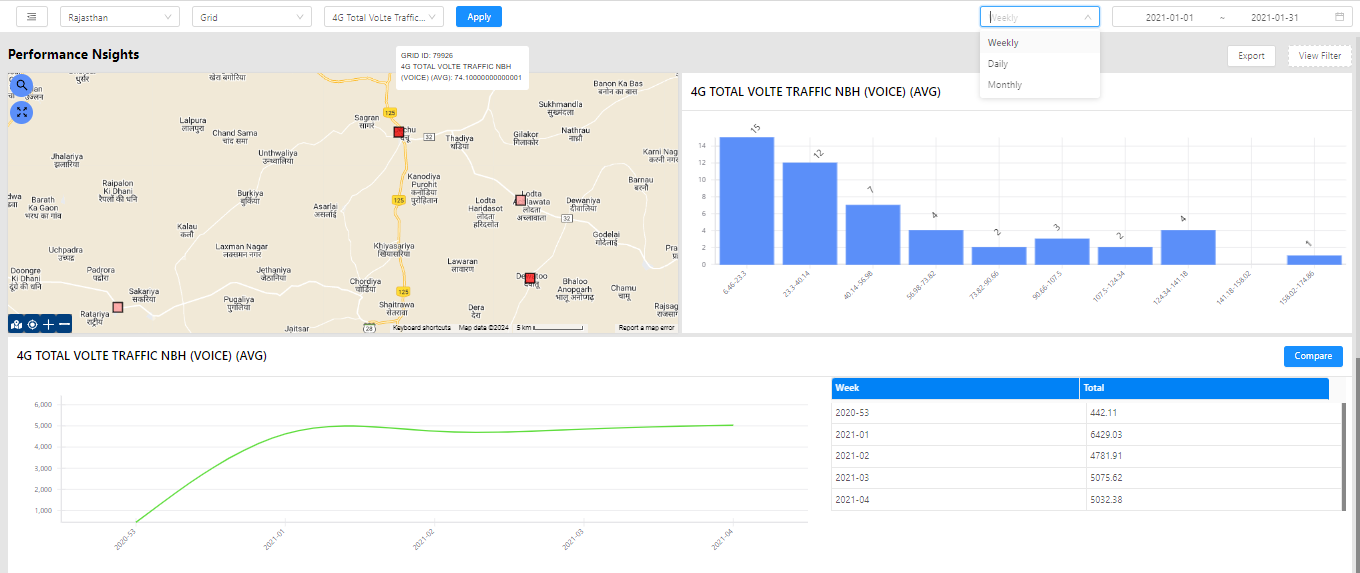
Tailormade for telecom, not generic BI
A horizontal BI tool gives you an empty canvas. neo360 starts from how a telco actually reads its network and its business, and treats the map as the interface every department shares.
Tailormade for telecom, not generic BI
Site and sector analytics, band-wise coverage, LAC-RAC-TAC, competition coverage overlay and route coverage are built in, not features you assemble inside a spreadsheet or a horizontal BI tool.
Network and business data, fused
OSS, call records, inventory, CRM, voice of customer, crowd-sourced data and the data warehouse meet on one map-centric platform, so a single source of truth replaces the silo per department.
Every department, out of the box
Finance, Sales, Marketing, Product, Customer Support and Operations each get a dedicated analytics view, plug and play, instead of waiting on a custom build.
Trusted by Vodafone
One source of truth, one shared picture.
Data silos limit insight, and every department ends up exporting the same data into different spreadsheets. neo360 puts network performance and business KPIs on the same map, so teams discover patterns in real time, read historical trends toward future optimization, and run department-wise KPI monitoring and gap analysis from a single source of truth.
See neo360 on your network.
Walk through the departmental analytics, coverage and competition layers, and a 5G FWA feasibility check with our team.