
SmartData · India Geospatial Data
Map the whole of India.
28 datasets, PAN India, built from primary field survey and refreshed every year.
Trusted by
The companies building on India already build on this data.
The world's leading mapping platforms license India data from Lepton, alongside public-sector mandates with Railtel and NIC.






Railtel · NIC
Explore SmartData
- The catalog: 28 datasets, 7 categories, one India Roads, addresses, POIs, boundaries, socioeconomic, 3D and mobility, layer by layer.
- What teams build on India ground truth Where field-surveyed layers answer real decisions across sectors.
- Build on it today, self-serve Toll, Fuel, Routes, Detect, Region and Catchment on a free tier with a live playground.
- From field survey to your stack How a layer goes from ground truth to digitization, enrichment and delivery.
- SmartData, your questions answered Freshness, rural coverage, custom data and how to try it.
Why teams build India on SmartData
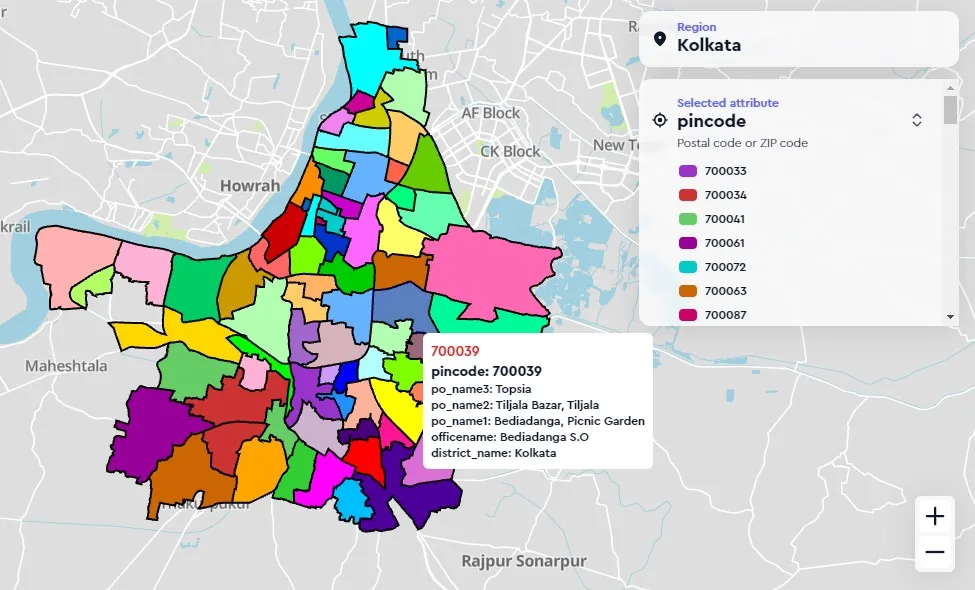
When global datasets are thin or wrong on India, the depth has to come from the ground. SmartData starts there, and carries the India-specific layers nobody else does.
Primary-survey origin, not scraped
Every layer begins as field-collected ground truth, not crowd-sourced or algorithmically inferred. Address points are ground-surveyed to building level, the identity the rest of the portfolio is built on.
The platforms build on this data
The world's leading mapping platforms license India data from Lepton. When the maps you already use need India depth, this is where it comes from.
India layers nobody else carries
Posted speed limits, four-level locality hierarchies, truck entry and exit timings, daily fuel prices, a FASTag-aligned toll matrix and society-level point lookup, the India-specific attributes global datasets are thin or wrong on.
What a layer actually looks like
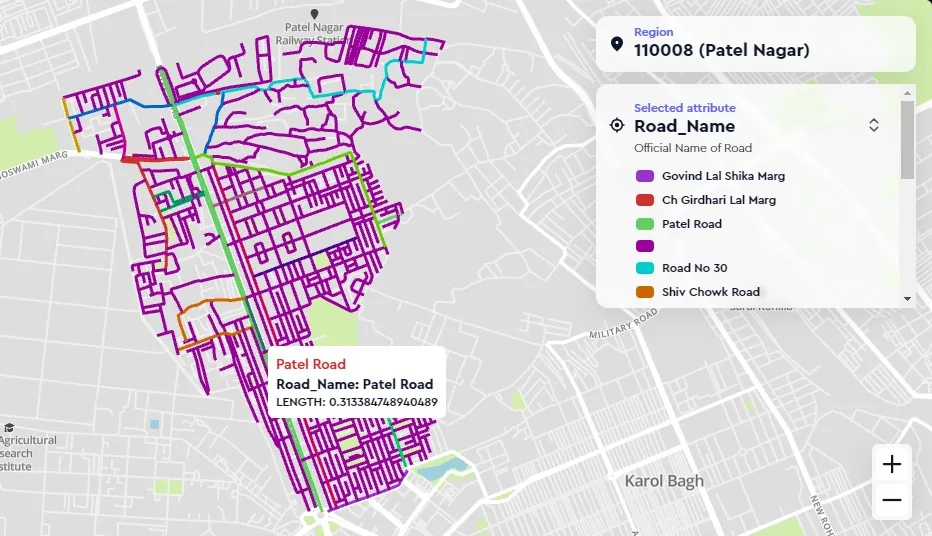
Every road, named, down to the lane.
This is one pincode of the road network as it renders in the data application: every segment carried, every segment named, each one clickable down to its own attributes. The same layer runs to 59,35,048 km across eleven road classes, with urban detail surveyed to 1:5,000. Attribute depth like this is what separates a surveyed network from a traced one.
Two ways it ships
License the layers, or call the endpoints.
The same ground truth reaches you on two surfaces. Datasets are licensed per product and delivered into your platform or enterprise pipeline. The APIs on leptonmaps.com expose the same depth as callable endpoints, with a free tier, a playground and a console, so a developer can build before a licensing conversation begins.
Logistics
Toll and Fuel Prices. Cost a journey on the FASTag-aligned toll matrix and the price posted that day, priced by vehicle class.
Routes
Path, Optimized Roundtrip, Node Linker, plus fueling stations and points of interest placed on the route itself.
Detect
Resolve one coordinate down the administrative hierarchy: state, district, tehsil, town, village, ward, pincode and society.
Region and GIS
States, districts, region search and area, plus Catchment, Nearby Places, Nearest POI and Natural Disasters Risk.
The third dimension
The same India, with height.
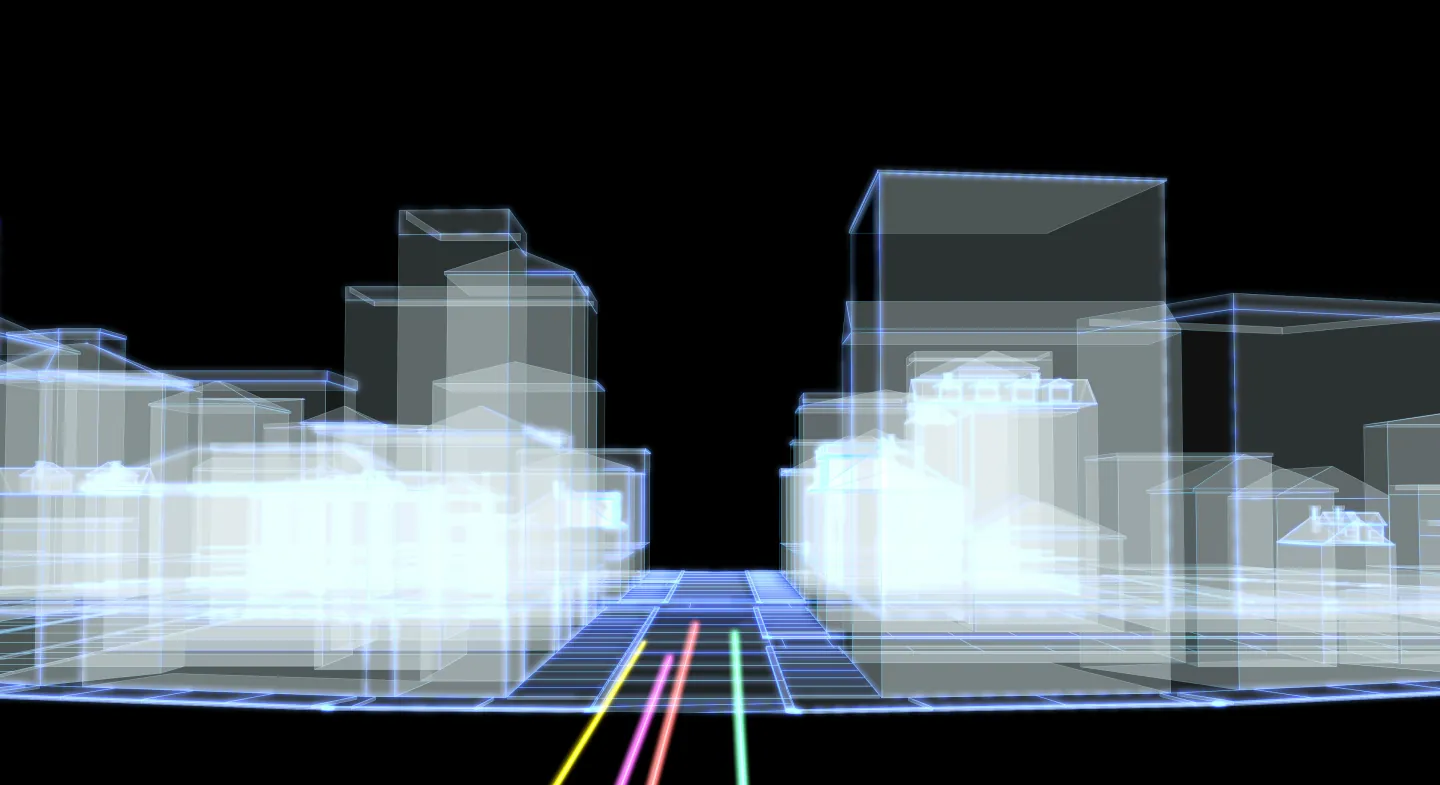
Above the 2D layers sits the 3D portfolio: building geometry across 922 cities and 62,000 square kilometres, with landmark heights in 129 cities, alongside land use, land cover and digital terrain models. It is the surface line-of-sight, RF planning and street-level context all have to be computed on.
The 3D city model at street level. Building volumes and road geometry as the data holds them.
Outcomes
India, surveyed layer by layer.
This is not one dataset with a wide footprint. It is 28 products across 7 categories, each built from primary field survey and refreshed every year, so the decision you make on India sits on ground truth rather than guesswork.
Get started
See SmartData on your use case.
Tell us the decision you are trying to make on India, and we will show you the exact layers and APIs that answer it.