
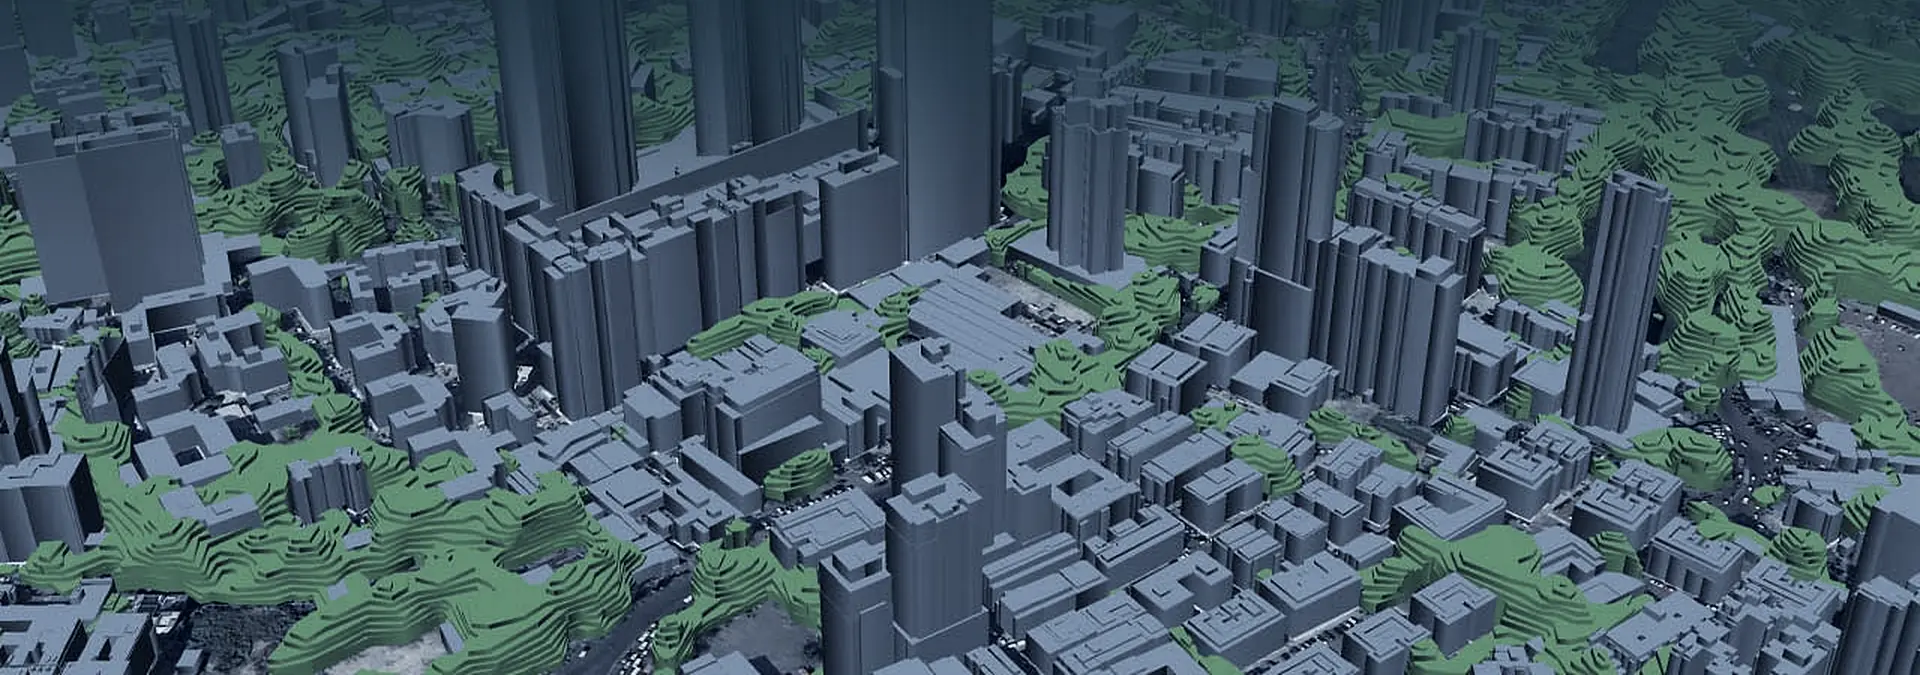
rfMAP · 3D Geodata for Wireless Network Planning
Plan 5G on a 3D map, not a 2D guess.
Buildings, vegetation, terrain and clutter at sub-meter accuracy, so line-of-sight is measured and not assumed.
Explore rfMAP
- Capabilities The complete layer stack for RF planning
- Use cases What teams plan with rfMAP
- How it works From satellite imagery to tool-ready layers
- Integrations Vendor-neutral data your RF tools already speak
- Engagement Off-the-shelf or made-to-order licensing
- FAQ Accuracy, layers, tool compatibility
Why RF teams plan on rfMAP
5G cells reach 300 to 500m and die on line-of-sight. You cannot plan that on a 2D guess. rfMAP gives you the real surface RF signals actually meet.
Authentic geo-data, not estimated
Vegetation in stacked polygons and per-building multi-polygon detail extracted from high-resolution multi-stereo satellite imagery, the real surface RF signals actually meet.
Sub-meter precision
Survey-grade accuracy for line-of-sight and micro-mapping, so small-cell and 5G placement decisions hold up against drive-test reality.
The complete layer stack
3D buildings, 3D vegetation with heights, 4D bridges, DTM, DSM, 2D vectors and clutter up to 35 land-use classes, every layer an RF model needs.
Works with every planning tool
Vendor-neutral output that feeds all major RF planning tools, drive-test equipment and GIS platforms, so it slots into the workflow you already run.
Why 3D matters
One sector, predicted twice.
The same 720 by 600 m extent, the same antenna. Panel A predicts on bare 30 m terrain. Panel B predicts on the rfMAP 3D surface: buildings, vegetation heights and 35-class clutter at 1 m. The point the terrain model accepts sits 23 dB deep in the shadow of a 24 m block, the kind of miss that only surfaces as a failed drive test after build.
A · Terrain-only model DTM 30 m, no structures
B · rfMAP 3D surface buildings + vegetation + 35-class clutter, 1 m
The data itself
The surface those predictions run on.
Every rooftop, tree line and street canyon in this model is geometry an RF signal has to clear. This is what your planning tool sees when it plans on rfMAP.
SmartSignal
Model the network before you touch the field.
rfMAP is the surface; SmartSignal is what plans on it. Set a mast height, a beam width and an azimuth, and SmartSignal traces line of sight across the 3D model to mark every building in range as reachable or blocked. The coverage prediction above is exactly this kind of modelling, run on rfMAP data. SmartSignal is sold with rfMAP and also on its own.
Feasibility per building
Line of sight traced against real building heights, so a result belongs to a specific premise rather than a coloured polygon.
Site inputs you can change
Raise the mast, widen the beam or turn the sector, and the served set is recomputed in the room.
Blocked premises shown
What a site will never reach is a result too, and it is what keeps unreachable addresses out of the rollout plan.
Sold together, or alone
rfMAP supplies the 3D surface the trace runs on. SmartSignal also runs on 3D city data you already own.
Coverage, modelled live from the site out.
Stand up a site on the twin and watch FWA and FTTX coverage propagate across the footprint, so the network you plan is the network you operate.
A network model you can actually trust.
SmartSignal keeps the twin matched to reality as the network grows and changes, so the model behind every decision is the current one. Test rollout and capacity changes on the twin before you commit them in the field, then plan maintenance and upgrades against an always-current picture of the access network.
Data behind wireless network planning and deployment for operators, OEMs and tower companies







Trusted by Airtel · Reliance Jio · Vodafone Idea · Ericsson · Nokia · American Tower
Outcomes
The dataset behind the rollout.
rfMAP is high-precision 3D, 2.5D and 2D map data with the layers an RF model needs, buildings, vegetation heights, terrain and clutter, at the scale and accuracy a national 5G rollout runs on: 128 countries and 3,150 cities already mapped.
Get started
See rfMAP on your rollout area.
Bring a city or a coverage footprint and our team will show you the 3D layers your RF planning tools can consume, line-of-sight and clutter included.