
rfMAP · How it works
From satellite imagery to tool-ready RF layers
rfMAP is built as a production pipeline, not a one-off export. High-resolution multi-stereo satellite imagery is turned into a complete 3D layer stack through photogrammetry and image processing, registered for accuracy, then exported in the formats your RF planning tools, drive-test rigs and GIS platforms already read.
Get a demo →The principle
A production pipeline, not a single export
5G cells reach 300 to 500m and die on line-of-sight, so RF planning cannot run on 2D centerlines. It needs building heights, vegetation, terrain and clutter, captured with enough precision that a planner can trust a line-of-sight call from the desk. rfMAP exists to produce exactly that data, and to keep producing it for new areas on demand.
The way to get there is a repeatable pipeline. Every stage below feeds the next, from raw imagery to a registered, tool-ready dataset, so the same standard holds whether you take an off-the-shelf city or commission a made-to-order area.
The pipeline
Five stages, imagery to layers
High-resolution multi-stereo imagery
The pipeline starts from high-resolution multi-stereo satellite imagery: the same ground tile captured from several angles, the input that makes true 3D reconstruction possible.
Photogrammetry and image processing
Lepton's GIS services arm turns the stereo imagery into geometry through photogrammetry and image processing, the step that lifts flat pixels into measurable surfaces and heights.
The complete layer stack
From that geometry the full stack is extracted: 3D buildings, 3D vegetation, 4D bridges, DTM, DSM/Clutter Height, 2D vectors and clutter classified into land-use classes.
QA and registration
Layers are checked and registered so they align to ground and to each other, holding the sub-meter precision RF planning depends on for line-of-sight and micro-mapping.
Export in tool-ready formats
The dataset is exported in formats compatible with all major RF planning tools, drive-test equipment and GIS platforms, so it drops into the stack your teams already run.
What comes out
Authentic geo-data, not a flattened model
The extraction step is where rfMAP earns its name. Vegetation is captured as stacked polygons with height attributes, and buildings as per-building multi-polygon detail rather than simple blocks, so the surfaces that block or carry a signal are represented as they really are. Clutter is the layer that lets a planning tool understand the ground itself.
Why each layer matters to RF planning
3D buildings and vegetation heights drive line-of-sight and signal-blocking decisions. DTM and DSM/Clutter Height give terrain and surface elevation. 2D vectors carry roads, rivers and coastline, and 4D bridges add structures that 2D maps miss. Clutter classifies the land-use morphology a propagation model needs.
Together they let a planner work on a faithful 3D scene instead of a centerline abstraction, which is what shortens the path from plan to a decision a field team can act on.
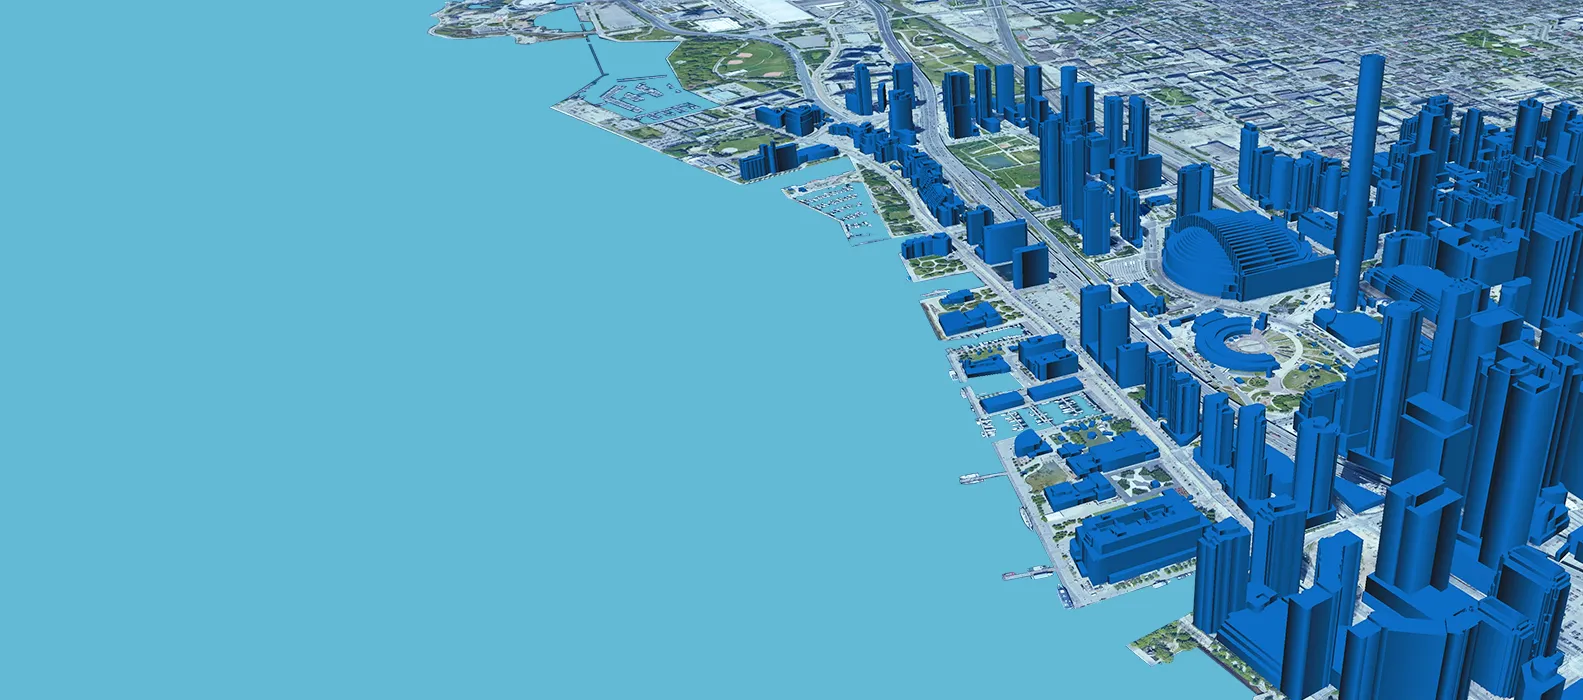
Multi-stereo
Imagery, resolved into a 3D layer stack.
Several satellite angles on one tile converge into measurable buildings, vegetation and terrain, registered to ground. The photogrammetry step, made literal: this is the dataset RF planning tools then read.
Coverage and demand
Off-the-shelf, or made to order
Much of the world is already mapped, so for many programs the dataset exists today. Lepton's mapping spans 128 countries and 3150 cities, the footprint behind a 3D dataset that powers more than 95% of India 5G deployment.
When an area you need is not in the off-the-shelf set, the same GIS services arm that builds the catalogue can produce it: photogrammetry and image processing techniques, run through the same pipeline to the same standard. The capability is made-to-order mapping of new areas on demand.
What the pipeline guarantees you receive
- 01
Authentic, sub-meter geo-data
Per-building multi-polygon detail and stacked vegetation polygons, registered at sub-meter precision for line-of-sight and micro-mapping.
- 02
The complete layer stack
3D buildings, 3D vegetation, 4D bridges, DTM, DSM/Clutter Height, 2D vectors and clutter up to 35 land-use classes, delivered as one coherent set.
- 03
Formats your tools already read
Output compatible with all major RF planning tools, drive-test equipment and GIS platforms, so the data drops into the stack you already run.
Proof
The pipeline behind India 5G
The same production pipeline supplies the 3D dataset that powers more than 95% of India 5G deployment, and feeds the planning tools and drive-test rigs that operators, network OEMs and tower companies already run.
- Airtel
- Reliance Jio
- Vodafone Idea
- Ericsson
- Nokia
- American Tower
See the layer stack on your own coverage area.
Bring a city or a corridor, and we will walk you through how rfMAP is built and delivered for RF planning.
Get a demo →