
Use case · Retail, FMCG and BFSI
Micro-market decisions, below the census
The census tells you the district. It cannot tell you the catchment around one candidate site. SmartData fills that gap with ward-level demographics, urban market profiles, footfall and a 30M+ POI layer, so the decision sits on the street, not the district average.
Get a demo →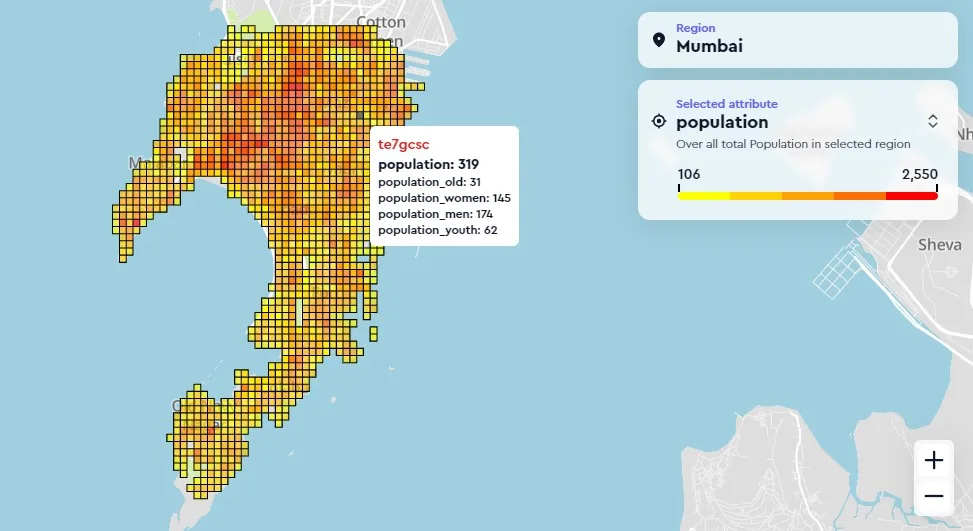
The decision
The census stops where the decision starts
Every site, territory and branch decision comes down to one question: who actually lives, works and moves around this exact location? For FMCG, retail and BFSI analytics teams, census-level data is too coarse for micro-market decisions. It can describe a district, but the choice between two candidate sites a kilometre apart is made on the street, not the district average.
So the gap gets filled with assumptions: a rough radius, a gut sense of the neighbourhood, a number borrowed from a larger area. The decision sits on guesswork at exactly the resolution where it costs the most to be wrong.
What a micro-market actually needs
Resolution below the district
- 01
Ward-level, not district-level
City Ward demographics resolve the population beneath the census, so a catchment reads on the ward it sits in rather than the district average around it.
- 02
An urban market read per town
The Urban Market Profile carries more than 200 variables across 7,795 towns, turning a location into a profile of the market around it, not just a head count.
- 03
A 100m grid in urban India
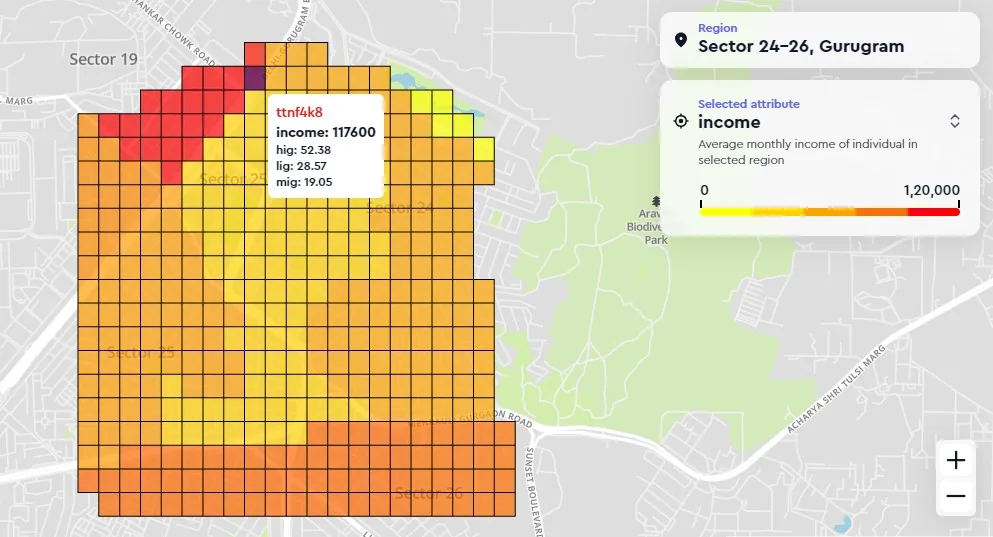
The Footfall index resolves to a 100m grid in urban areas and a 500m grid in rural ones, so the busy corner reads differently from the quiet one a block away.
- 04
What is already on the ground
A primary-surveyed layer of 30M+ points of interest, including 1,09,000 QSR outlets with cuisine-level attributes, shows what already trades inside the catchment before you commit to it.
The mechanism
Draw the catchment, read what is inside it
The Catchment and Nearby APIs turn a candidate location into a defined trade area on the map, then read the demographics, market profile, footfall and points of interest that fall inside it.
One coordinate becomes a scored micro-market: who is around it, how busy it is, and what already competes for them, on layers built from primary field survey rather than guesswork.
The layers behind the decision
India ground truth, at micro-market resolution
These are not estimates stretched over a wide footprint. The Socioeconomic category carries the Urban Market Profile, City Ward demographics, India GDP and the Footfall index, and they sit on the same primary-surveyed foundation as the 30M+ POI layer. The decision reads on ground truth at the resolution it is actually made.
Honest about freshness
Built from survey, refreshed every year
Every layer here begins as primary field survey, not crowd-sourced or algorithmically inferred, and the portfolio is refreshed on an annual cycle. That is the right cadence for site and territory decisions, where the question is the shape of a market rather than this morning's traffic. Where you need a live read, the same APIs let you query the current state on demand.
- 01
Score sites, not regions
Two candidate locations a kilometre apart get two distinct catchments, scored on the demographics, footfall and competition that actually surround each one.
- 02
Cut the cannibalisation risk
The 30M+ POI layer shows what already trades inside a catchment, so a new branch or outlet is placed against real competition, not a blank map.
- 03
One India, one method
The same survey-built layers cover 7,795 towns the same way, so a market in one city is read on the same footing as a market in another.
Proof
India data trusted at national scale
The world's leading mapping platforms license India data from Lepton, and the same survey backbone underpins public-sector mandates with Railtel and NIC, including a 40,000+ km NOFN infrastructure survey and the enhancement of 4,08,563 sq km of map to 1:10,000. The ground truth behind a catchment decision is the ground truth behind the map.
Score your next sites on India ground truth.
Bring a shortlist of candidate locations, and we will show you the catchment, demographics and footfall around each one on SmartData.
Get a demo →