
SmartData · Catalog
28 datasets, 7 categories, one India
The full SmartData portfolio, organized the way you license it: seven categories, 28 datasets, all PAN India, all primary-survey origin with an annual refresh. Start with one layer, expand into bundles as your use case grows.
Get a demo →How to read it
One portfolio, licensed layer by layer
SmartData is India's most comprehensive geospatial data portfolio: 28 datasets organized into 7 categories, all built PAN India and refreshed annually. The whole thing is primary-survey origin, field-surveyed rather than scraped or inferred, which is why the world's leading mapping platforms license India data from Lepton.
You do not have to take all of it. Every dataset is a licensable layer. Most teams start with the one layer their use case needs, then expand into bundles as they go deeper into India coverage.
Category 1 · Core Geography
The base map of India
- 01
Admin Boundaries
Boundary polygons and centroids for the full administrative hierarchy, the frame every other layer hangs on.
- 02
Populace+, population down to the village
36 states, 784 districts, 7,006 tehsils and 6,41,731 villages, so coverage reaches below the census grid.
- 03
Town and village points
Named settlement points across the country for routing, catchment and last-mile reach.
Category 2 · Road & Navigation
India's roads, the way they actually drive
- 01
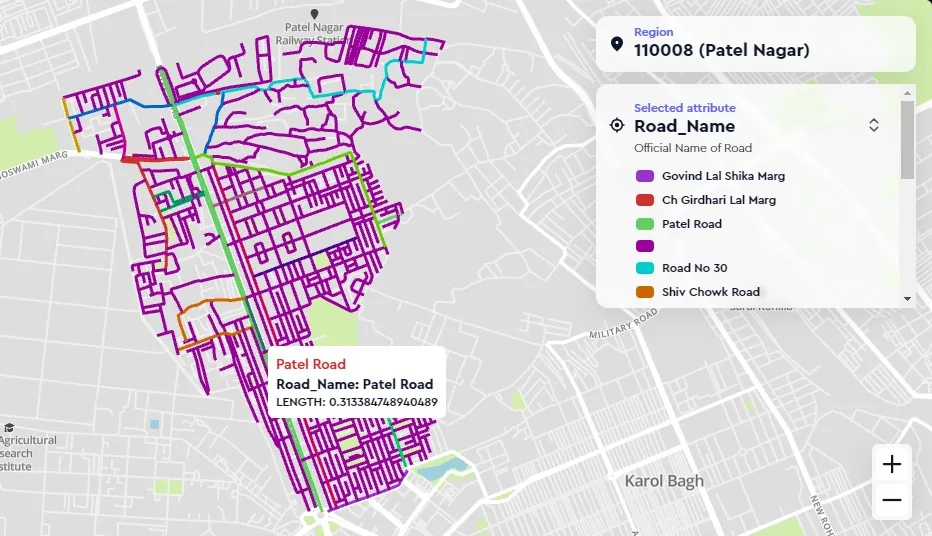
Road network, 59,35,048 km in 11 classes
The full navigable network, classified into 11 road classes with urban detail down to 1:5,000.
- 02
Posted speed limits and truck timings
India-specific layers that global datasets get wrong or leave empty: posted speed limits and city truck entry and exit timings.
- 03
Closures and accident zones
Real-time road closures in 37 cities in CIFS format, plus accident-zone data for safer routing.
- 04
Toll and daily fuel
A toll matrix across 1,780 toll points and daily fuel prices, so route costing reflects what a trip really costs.
Category 3 · Address & Location
India addresses, geocoded to the building
- 01
Address points, 2.17 crore ground-surveyed geocodes
Building-level address points, surveyed on the ground rather than algorithmically inferred.
- 02
Locality+, a 4-level locality hierarchy across 5,006 cities
The locality-centric structure Indian addresses actually use, where flat global geocoders fail.
- 03
IndiaPin, 19,538 pincode polygons
Pincode boundaries as polygons, not points, for clean territory and serviceability logic.
- 04
Buildings, polygons with entry and exit
Footprints with entry and exit information for accurate last-mile and field navigation.
Category 4 · Landmarks & POI
30M+ points of interest, classified for India
A points-of-interest layer of over 30 million entries, organized across 50+ categories and 180+ subcategories. It is deep in the segments Indian use cases lean on, with 1,09,000 QSR outlets, 73,277 clinics, 25,937 doctors and 6,525 EV charging stations already mapped.
Category 5 · Socioeconomic
Demand and demography, below the census
- 01
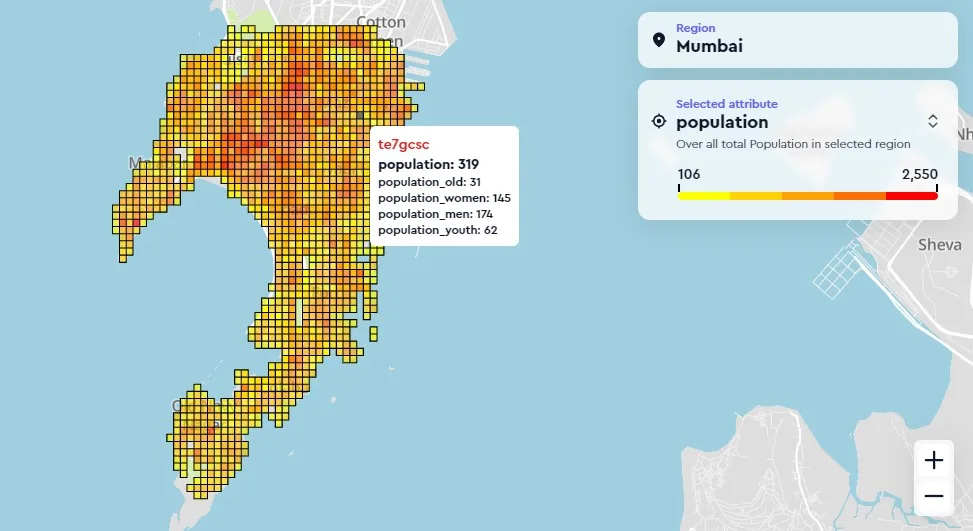
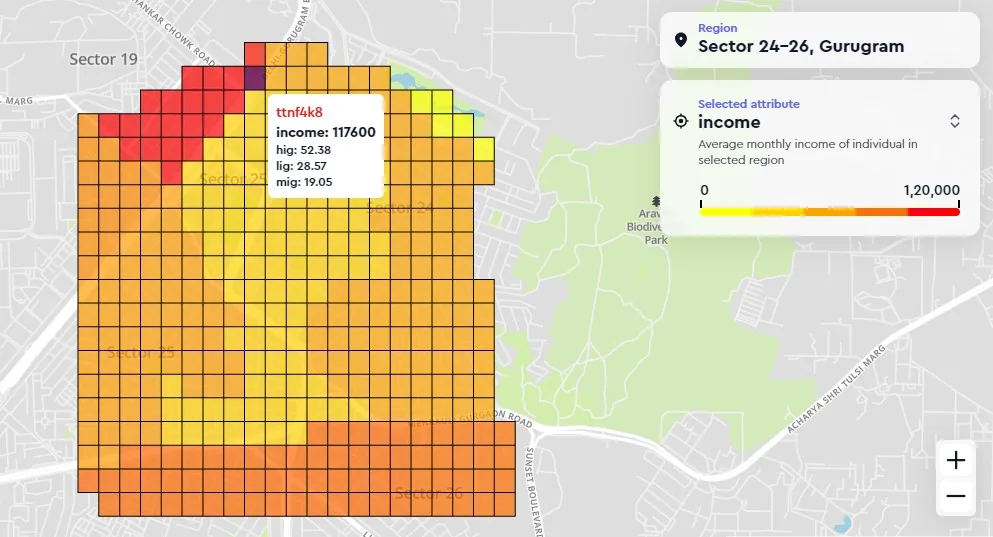
Urban Market Profile
7,795 towns scored across 200+ variables, for micro-market decisions the census is too coarse to support.
- 02
Rural and district economy
5,861 tehsils of rural profiling and India GDP across 583 districts, for catchment beyond the metros.
- 03
City ward and footfall
Ward-level data for 1,663 cities and a footfall index on 100m urban and 500m rural grids.
Category 6 · Remote Sensing & 3D
The terrain and the third dimension
- 01
3D buildings, 922 cities and 62,000 sq km
3D building data across 922 cities covering 62,000 square kilometres, with landmark heights in 129 cities.
- 02
rfMap LULC and DTM
Land use and land cover with digital terrain models, compatible with the RF planning stacks teams already run.
- 03
Village-level soil map
Soil classification mapped to the village level for agriculture and land-use analysis.

Category 7 · Mobility & Infra
How India moves, and what it is building
- 01
eTransit GTFS, 24 cities
Public-transit feeds across 24 cities and 47+ agencies, including India's first real-time GTFS feeds in DIMTS Delhi, WBSTC Kolkata and Mysore City Transport.
- 02
InfraNow, 30,155 live projects
A rolling view of 30,155 live infrastructure projects across 35 sectors.
- 03
Railway track, 1,40,647 km
The national railway track network, for corridor, logistics and infrastructure analysis.
What a licence hands over
The sheet a delivery reads like
A licensed extract does not arrive as a promise, it arrives as layers with counts, geometry, a field schema, positional accuracy, a projection and refresh dates by state, and the totals have to reconcile. This is the sheet, drawn at full size.
Layers accuracy quoted CE90 against survey control
| Layer | Geometry | Features | Attrs | Cadence | Accuracy | Refreshed |
|---|---|---|---|---|---|---|
| road_network | line | 8,942,600 | 41 | monthly | ±3.5 m | 2026-07-28 |
| building_footprints | polygon | 24,618,000 | 12 | quarterly | ±2.0 m | 2026-07-11 |
| poi | point | 6,113,400 | 23 | monthly | ±5.0 m | 2026-07-30 |
| admin_boundaries | polygon | 7,416 | 9 | on notification | 1:50,000 | 2026-06-19 |
| pincode_boundaries | polygon | 19,300 | 6 | half-yearly | 1:50,000 | 2026-05-02 |
| landuse | polygon | 1,499,284 | 8 | yearly | 10 m raster | 2026-03-15 |
| bundle | 41,200,000 |
Attribute schema road_network · 8 of 41 fields
| Field | Type | Populated |
|---|---|---|
| road_class | varchar(24) | 100% |
| name_en | varchar(120) | 87.2% |
| name_lang | varchar(120) | 71.4% |
| speed_kmph | smallint | 64.8% |
| lane_count | smallint | 58.1% |
| surface | enum(4) | 92.6% |
| oneway | bool | 100% |
| toll | bool | 100% |
Coverage by state top six by road km, of 36
| State / UT | Road km | POI | Buildings | Refreshed |
|---|---|---|---|---|
| Uttar Pradesh | 517,640 | 731,900 | 88.6% | 2026-07-24 |
| Maharashtra | 448,120 | 782,400 | 94.1% | 2026-07-28 |
| Karnataka | 314,220 | 604,150 | 95.0% | 2026-07-28 |
| Tamil Nadu | 271,480 | 592,300 | 96.3% | 2026-07-26 |
| Gujarat | 226,940 | 438,700 | 93.2% | 2026-07-21 |
| Delhi NCT | 33,180 | 401,220 | 98.4% | 2026-07-30 |
| 30 further states / UTs | 3,048,420 | 2,562,730 | 81.7% | rolling |
| all India | 4,860,000 | 6,113,400 |
The principle
Data that fits the pipeline you have
Integrating new geospatial data usually means a build step: a custom parser, a reformatting job, a schema someone has to reverse-engineer. SmartData is delivered the other way around. Every layer ships in the open, standard formats your tools already understand, so the data lands in your stack and is usable straight away.
That holds on both delivery surfaces. You can license datasets directly into your platform or enterprise pipeline, or build on the SmartData APIs at leptonmaps.com. Either way, the formats are standard and the integration is a connection, not a project.
Delivery formats
The standards the data ships in
- 01
Closures and ADAS, in CIFS
Real-time road closures ship in CIFS, the Closure and Incident Feed Specification, and the same closure data is ADAS-compatible for in-vehicle navigation and driver-assistance systems.
- 02
Transit, static and real-time, in GTFS
Public-transit feeds in GTFS static and GTFS real-time, the standard the transit world already consumes, including India's first real-time GTFS feeds in DIMTS Delhi, WBSTC Kolkata and Mysore City Transport.
- 03
Boundaries as polygons plus centroids
Administrative boundaries delivered as polygons with matching centroids, so spatial joins, point-in-polygon lookups and labelling work out of the box.
- 04
Remote sensing and terrain as raster
Remote-sensing and terrain layers delivered as raster, ready to drop into the GIS and analysis tools your team already runs.
RF planning
Compatible with the RF stacks you run
For radio and network planning, the terrain and clutter layers reach you through rfMap, built to fit the planning tools teams already use. The data is compatible with the major RF planning stacks, so it loads into your existing workflow rather than forcing a new one.
- 01
Atoll
rfMap terrain and clutter layers compatible with Atoll, so planning runs on India ground truth without changing tools.
- 02
Planet
Layers delivered to fit Planet, keeping your RF planning workflow intact while the underlying India data improves.
- 03
ICS Telecom
Compatible with ICS Telecom, so coverage and propagation studies use the same surveyed terrain as the rest of the portfolio.
- 04
WRAP
Compatible with WRAP via rfMap, bringing India-grade land use, land cover and digital terrain models into the planning tool you already operate.
Composes across the portfolio
The same data other Lepton products build on
Because every layer ships in standard formats, the data composes with the rest of the Lepton portfolio out of the box. The same India ground truth that lands in your pipeline is what other Lepton products are built on, which is the clearest test that the formats are genuinely standard.
- 01
SmartMarket, Data Observatory
SmartMarket's Data Observatory consumes the socioeconomic and location layers for catchment and market analysis.
SmartMarket - 02
rfMAP, RF planning data
rfMAP carries the terrain and clutter layers into RF planning, the same layers it exposes to Atoll, Planet, ICS Telecom and WRAP.
rfMAP - 03
neo360, street-level context
neo360 builds on the survey-grade road and location data, evidence the layers compose cleanly across products.
neo360
Two ways to take it
Licensed datasets, or self-serve APIs
Every layer in the catalog reaches you on two surfaces. You can license the datasets directly, delivered to your platform or enterprise stack. Or you can build on the SmartData APIs at leptonmaps.com, with a free tier, a playground and a console covering Toll, Fuel, Routes, Detect, Region, Catchment, Nearby and Natural Disasters Risk.
Proof
Trusted at national scale
The same catalog runs under public-sector mapping at the scale of national infrastructure. Railtel and NIC used Lepton data for a NOFN infrastructure survey and a country-scale map enhancement, proof the portfolio holds up across all of India.
Pick the layers your use case needs.
Tell us what you are building. We will map it to the right datasets across the seven categories and the SmartData APIs.
Get a demo →