
Industry · FMCG & Retail
Where to expand. Where to deepen distribution.
Procter & Gamble, Dominos, OYO, and Shiprocket use Lepton's location intelligence to find white-space markets, optimise store rollouts, and route the last mile, across India's most-fragmented retail geography.
FMCG and retail customers running on Lepton


Use cases
What FMCG and retail teams build with the platform.
Finding an uncovered market, ranking the next store and routing the drop that serves it are three views of one geography. They read from the same POI, demographic and road data, so distribution and expansion stop planning against different maps.
- 01
Distribution coverage discovery
P&G uses POI density and demographic spend power to find tier-2 and tier-3 markets where competitors aren't yet covered. Filled 1,200+ uncovered POIs in a 90-day sprint.
SmartMarket - 02
Store rollout and catchment
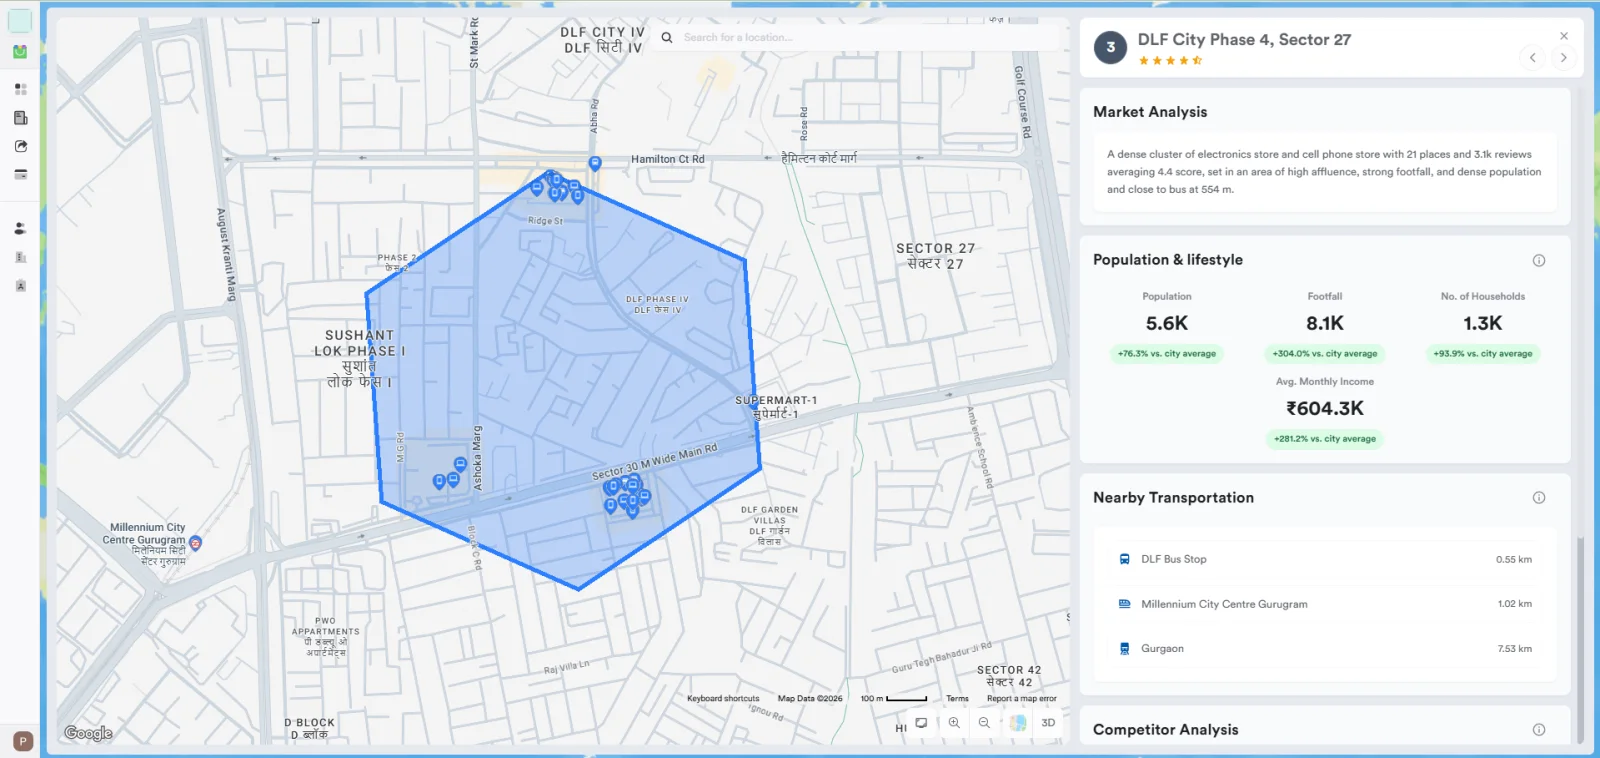
Dominos and OYO use catchment analysis and competitor density to short-list growth locations. 12% revenue lift in pilot stores.
SmartMarket - 03
Last-mile delivery optimisation
Hyperlocal delivery operators use Lepton's India road graph and vehicle restrictions for sub-minute ETA optimisation.
Google Maps Platform
Products for FMCG and retail
Score the micro-market, then serve it.
Three standalone products: SmartMarket ranks the candidate, SmartData supplies the POIs and demographics it scores against, and Google Maps Platform routes the delivery that follows.
SmartMarket
Branch and store siting, plus cannibalisation modelling.
SmartData
50M+ India POIs, plus demographic and consumption data.
Google Maps Platform
Routing, Places, Geocoding for delivery and dispatch. Bought through Lepton as a Google Maps Platform Premier Partner.
From a retail expansion team
The guess became a ranked list.
We were guessing where to place outlets. SmartMarket replaced the guess with a ranked candidate list, our pilot stores hit revenue 12% above benchmark.
Questions
What FMCG and retail leadership asks first.
- 01
Do you cover tier-2 and tier-3 India?
Yes, that's the strength of SmartData. 50M+ Indian POIs with deep coverage outside metros, refreshed weekly. Catchment and demographic granularity down to pincode.
- 02
Can outputs feed our existing BI?
Yes. Tableau, Power BI, Looker, plus any GIS reading Shapefile, GeoJSON or KML. Most FMCG customers pipe Lepton output directly into their planning dashboards.
- 03
Pilot before commitment?
Yes, free 100km² sample of SmartData, free location recommendation for SmartMarket. Most evaluations conclude in 2-3 weeks.
Tell us the decision. We'll route the right team.
Send the geography and the problem. Within 48 hours you get a response from a specialist who has built it for someone like you.
- 48-hour response from an FMCG and retail specialist
- Reference calls with named FMCG and retail clients
- Optional pilot before contract
Request received.
A specialist will reach out within 48 hours, with the relevant data ready.
Need something sooner? Write to info@leptonsoftware.com.